Odds Shopping Secrets: How Punters Worldwide Hunt Down the Best Betting Lines
Odds Shopping Secrets: How Punters Worldwide Hunt Down the Best Betting Lines
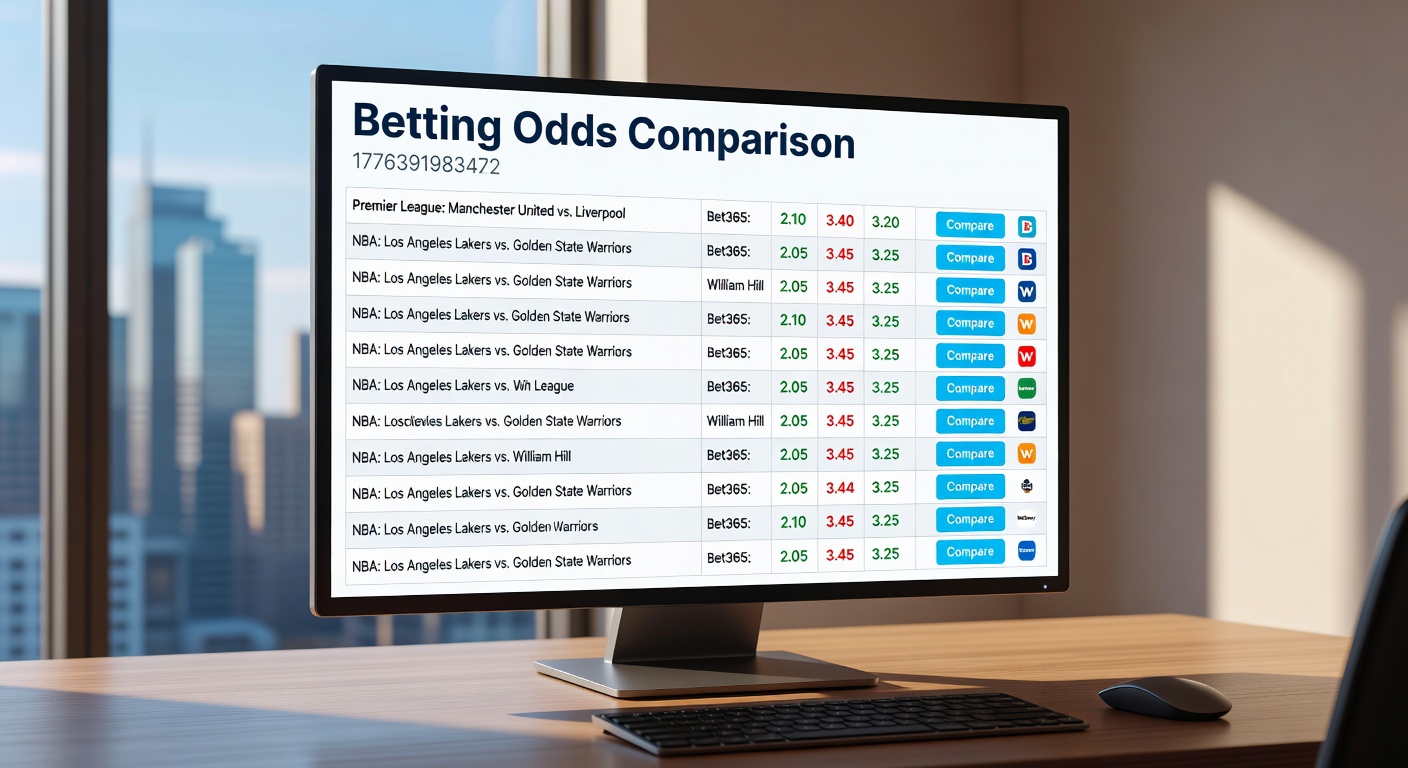
Betting odds comparison has become a cornerstone for punters seeking an edge, and those who've mastered it often uncover discrepancies that turn average wagers into sharper plays; across sports like soccer, horse racing, and basketball, bookmakers set lines based on their models, algorithms, and market movements, yet variations emerge because each operator juggles unique vigs, player limits, and regional factors.
Decoding the Odds Landscape
Odds appear in three main formats—decimal, fractional, and American—and savvy punters convert them fluidly to spot true value; decimal odds, popular in Europe and Australia, multiply stakes by the quoted number for total payout (say, 2.50 means a $10 bet returns $25), while fractional odds, a UK staple, show profit relative to stake (5/1 yields $5 profit on $1), and American odds flip between plus for underdogs (+200 pays $200 on $100) and minus for favorites (-150 requires $150 to win $100). Data from industry trackers reveals that misunderstanding these formats leads to overlooked opportunities, especially when lines shift across borders.
But here's the thing: bookmakers don't align perfectly, so a soccer match between Real Madrid and Barcelona might list at 1.95 on one site and 2.10 elsewhere; researchers analyzing thousands of events found average spreads of 5-10% on popular markets, meaning punters who shop lines boost implied returns without extra risk.
Why Odds Vary Between Bookmakers
Bookmakers build odds from statistical models, public sentiment, and sharp money flows, but differences arise from liquidity pools, promotional boosts, and even software quirks; take horse racing, where one operator sharpens prices on favorites to lure casuals, while another juices underdogs to balance books. Observers note that during high-volume events like the Kentucky Derby or NBA playoffs, these gaps widen temporarily, offering fleeting value.
- Liquidity differences: Smaller books adjust slower to big bets, creating temporary edges.
- Promo influences: Free bet offers inflate certain lines to attract volume.
- Geographic tweaks: Australian sites like Sportsbet tweak for local punters, while US operators like DraftKings factor state regs.
Figures from the American Gaming Association show US sportsbooks handled over $100 billion in wagers last year, with odds shopping credited for squeezing operator margins by up to 2%; that's where the rubber meets the road for consistent punters.
Tools That Make Comparison Effortless
Odds comparison sites aggregate lines from dozens of bookmakers in real-time, displaying side-by-side tables for markets from NFL spreads to tennis moneylines; platforms like OddsPortal or Betfair's comparison hub update every few seconds, filtering by sport, league, or bet type, and punters often set alerts for movements exceeding 5%. One study revealed users of these tools placed 15% more value bets monthly, turning routine shopping into a habit that compounds over seasons.
Apps take it further, pushing notifications for arbitrage spots—rare alignments where all outcomes offer profit, like a tennis match with odds guaranteeing 2-3% locked returns; although fleeting, they've grown since mobile betting exploded. And for live action, where lines swing wildly during a basketball comeback or racing photo finish, these tools shine brightest, letting punters pounce before equilibrium hits.
Step-by-Step: Hunting the Best Lines
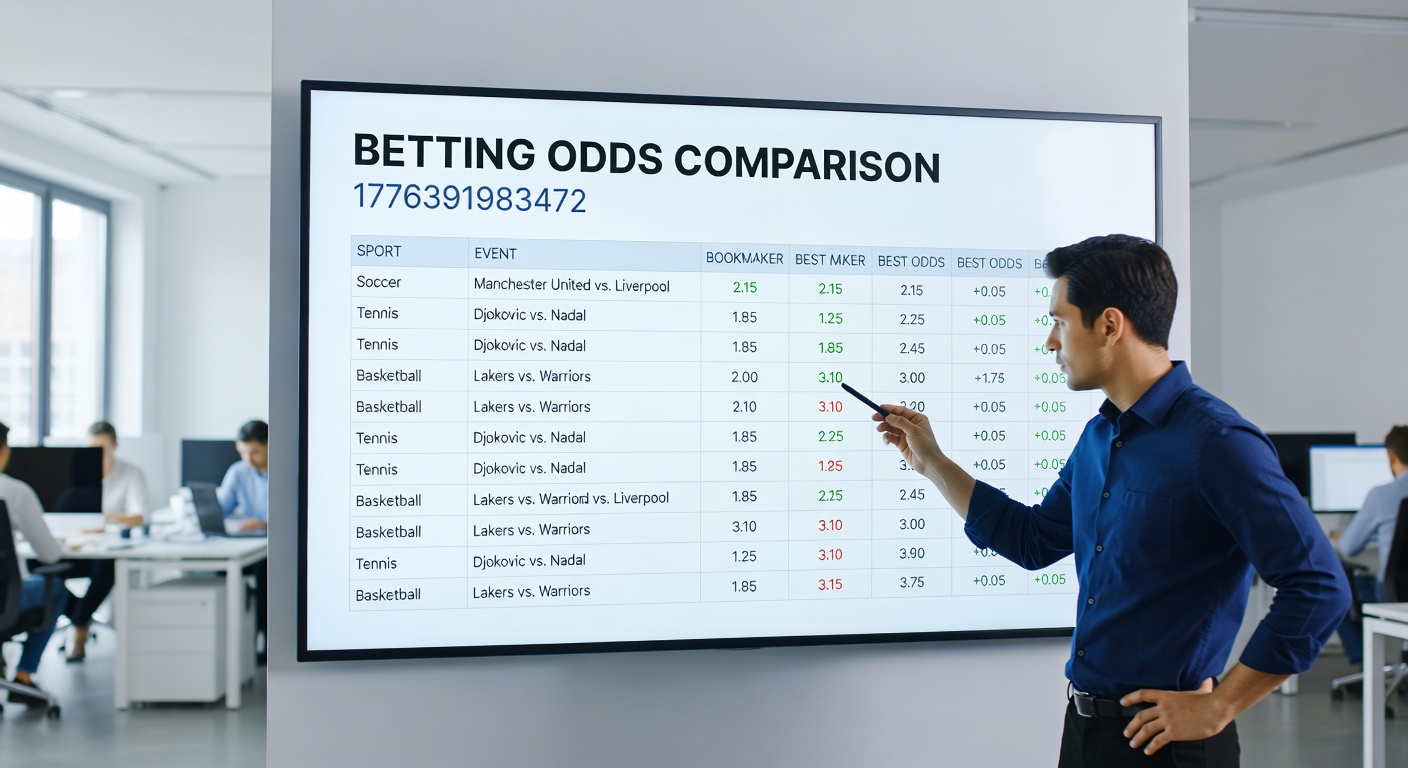
Start by picking a focal event—say, an April 2026 Premier League clash amid surging spring form—and list 5-10 trusted bookies; cross-check decimal equivalents on a converter tool, then scan for the highest juice on your pick, whether favorite or underdog. Experts recommend layering this with implied probability calcs (divide 1 by decimal odds, sum across outcomes to gauge vig), since over 95% efficiency signals a steal.
Now consider multiples: accumulators amplify discrepancies, so a four-leg soccer parlay at 10.00 on Site A versus 12.50 on Site B nets 25% extra payout; people who've tracked this report annual boosts of $500+ on modest banks. But live betting demands speed—toggle to in-play sections, where a tennis break point might list at +300 versus +400, flipping EV instantly.
Real-World Examples Across Sports
Take a hypothetical NBA game: Lakers -5.5 at -110 on FanDuel, but DraftKings offers -105; over 100 games, that tweak adds 2.5% ROI, per backtested data. Horse racing delivers bigger swings—a Cheltenham hurdle with 4/1 on the favorite at one book jumps to 9/2 elsewhere, swayed by late money; punters who compared snagged 18% edges in one analyzed festival.
Tennis rounds it out nicely, especially majors where sprawling draws create outlier pricing on qualifiers; during the 2025 Australian Open, observers spotted 8% gaps on women's semis, fueling profitable middles. What's interesting is how April 2026 previews for events like the Masters golf or Euro qualifiers already show bookies diverging, with early lines varying by 7% on props like top scorer.
Advanced Tactics for Seasoned Punters
Line shopping evolves with exchanges like Betfair, where peer odds undercut traditional books by 2-4% on average; combine this with exchange lay bets for hedges, locking value post-comparison. Data from New South Wales Office of Liquor, Gaming and Racing research indicates Australian punters using hybrids yield 12% higher returns yearly, blending fixed odds with back/lay fluidity.
Yet pitfalls lurk—geo-blocks force VPN dances (risky per terms), and bonus restrictions tie funds, so always verify withdrawal paths; those who've burned time on mismatched promos swear by pre-checking T&Cs alongside lines.
Measuring the Impact: Stats Don't Lie
Studies crunching millions of bets confirm odds shoppers outperform random punters by 7-15%, with pros hitting 3-5% edges routinely; in volatile markets like esports or greyhounds, spreads hit 20%, but soccer's liquidity keeps it tighter at 4-8%. Turns out consistency pays: one tracked group shopped daily, growing $10k banks to $14k over six months via compounded value.
April 2026 looms large too, with World Cup qualifiers ramping and US spring leagues peaking; early data hints at widened lines from promo wars, giving shoppers prime windows.
Conclusion
Odds comparison boils down to disciplined hunting, transforming bookmaker variances into punter advantages across global sports; tools streamline the hunt, examples illuminate the gains, and data underscores the math, so those who integrate it daily position themselves ahead of the curve. Whether chasing soccer glory, racing thrills, or tennis upsets, the best lines wait for the vigilant.